Neil Martinez
Data Analyst

Hi, I'm Neil Angelo Martinez, an aspiring data analyst with a strong desire to learn and grow, I am excited to bring my passion and dedication to the field. I am currently enrolled in Refocus, the top data analytics bootcamp in the Philippines, where I have gained a solid foundation in tools such as Excel, SQL, Power BI, and Python. In addition to my formal education, I have also taken the initiative to continue learning and developing my skills through online courses and virtual internships. I am confident that my strong foundation and eagerness to learn will enable me to excel as a data analyst and make valuable contributions to any organization.
Download CVData-Driven and Dedicated
Aspiring Data Analyst Ready to Make an Impact
My name is Neil Angelo Martinez and I am an aspiring data analyst. As an aspiring data analyst with a strong desire to learn and grow, I am excited to bring my passion and dedication to the field. I want to share my story in discovering data analytics, October 27, 2022 I received a call from a marketing agent about the opportunity to become a data analyst. Recognizing the potential for a fulfilling and exciting career in this field, I immediately enrolled in Refocus to fast track my education and training in data analytics. I was excited to have this opportunity and was committed to making the most of it.
Through my studies at Refocus , I gained a strong foundation in the tools and techniques used in the field, as well as the practical experience needed to succeed as a data analyst. I also participated in a group project assignment where our data analytics skills and presentation skills were tested. While enrolled in Refocus, I also took some online virtual trainings like Data Analytics and Visualization from Accenture North America, Power BI in Data Analytics by PwC Switzerland, and Career essentials in Data analysis by Microsoft and LinkedIn and completed online certifications like Google Data Analytics, IT Automation with Python, and Microsoft Power Platforms.
LinkedIn Profile-
SQL
90% -
Power BI
95% -
Python
70% -
Excel
95%
Data Analysis and Visualization
Portfolio
Check out some of the case studies I made as a Data Analyst.
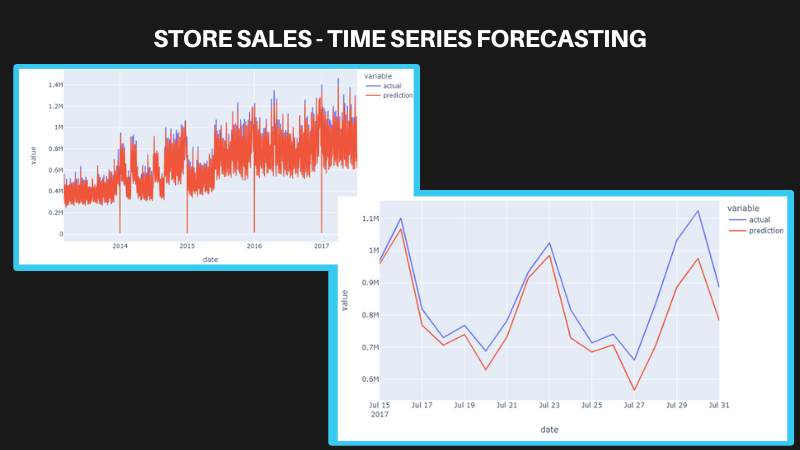
Store Sales - Time Series Forecasting
This is my submission for the Store Sales - Time Series Forecasting competition. It's a really cool competition that challenges us to use time series forecasting techniques to predict sales for a bunch of stores over the next few months. Time series forecasting is a fancy way of saying that we get to use past data to try and predict what will happen in the future. It's a useful skill to have because it helps organizations make smart decisions about the future.
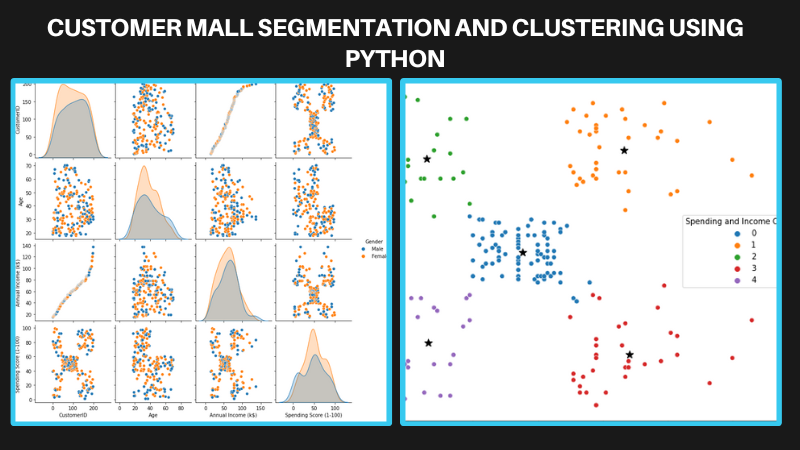
Customer Mall Segmentation and Clustering using Python
The purpose of this project was to identify the most important customer groups for a marketing team to target using data analysis and machine learning approaches. The project’s data comprised of information about mall clients, such as their age, gender, annual income, and spending score.
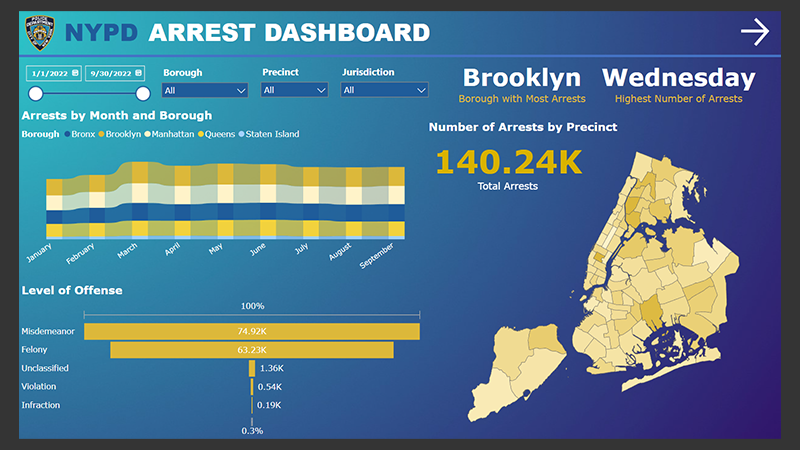
NYPD Arrest Data 2022 (Q1-Q3)
This study aims to analyze and recognize patterns and trends in New York City police enforcement activity as represented in statistics on arrests made by the NYPD. The information comprises the type of crime, the location and date of enforcement, and perpetrator demographics. By examining this data, it is intended to obtain insight into the nature of police activity in the city and how it may change depending on criteria.
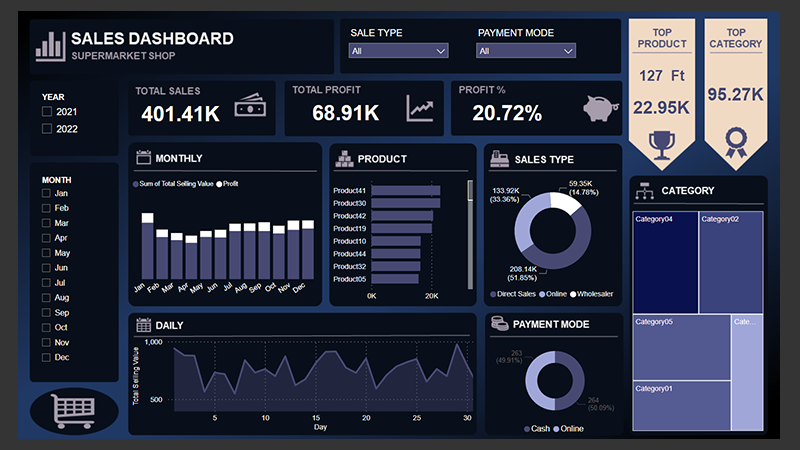
Supermarket Sales Dashboard
I created a supermarket sales dashboard in Power BI that offers a comprehensive and intuitive overview of the company's sales performance. The dashboard features a range of interactive charts and graphs that provide valuable insights into key metrics such as sales revenue, profit margins, and customer types.
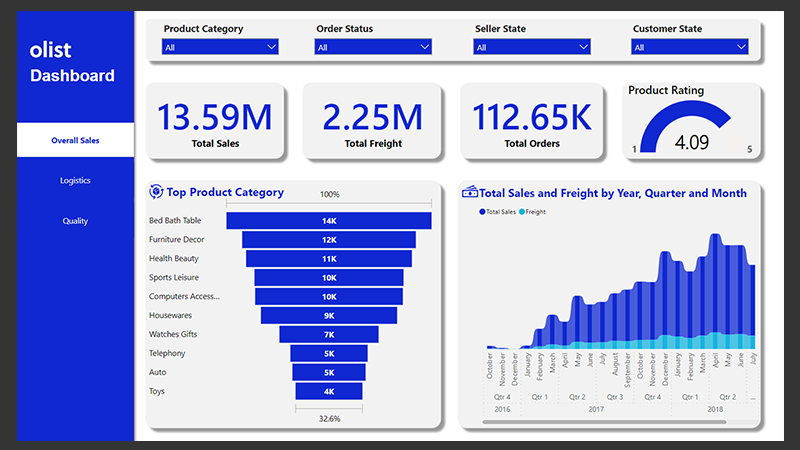
Olist eCommerce Analysis
The dataset for this study is from a Brazilian e-commerce company called Olist Store. It contains information on 100,000 orders made from 2016 to 2018 from various marketplaces in Brazil. The dataset includes details such as the status of the order, the price and payment information, customer location, and product attributes.

Accenture Data Analytics Virtual Program
This is the case study I made during the Accenture Data Analytics Virtual Program in partnership with Forage. The program is very intuitive and easy to follow. The goal of this case study is to help a small company: Social Buzz, in the analysis of their content categories that highlights the top 5 categories with the largest aggregate popularity. They want to learn data best practices from a large corporation. Due to the nature of their business, they have a massive amount of data so they are keen on.
Output
Platforms
These are the websites where you may view all of my work. I use Github to host all of my repositories. Medium is where I document and share the process of my projects. Last, novyPro is where I publish my Power BI dashboards.
Recent Articles
Achievements
-
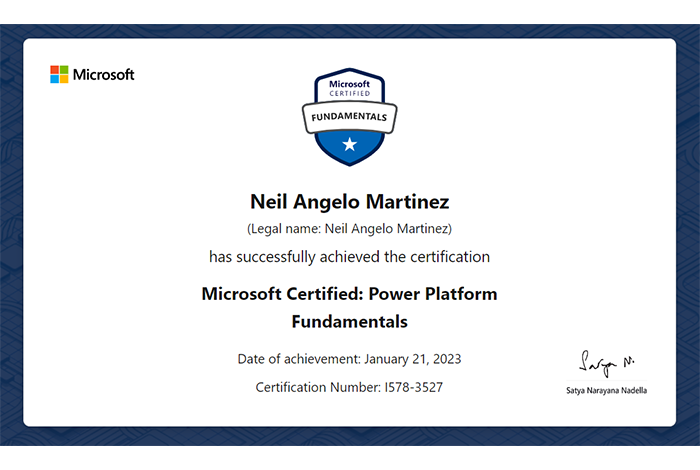
Microsoft Certified: Power Platform Fundamentals
I have successfully passed the Microsoft Power Platform Fundamentals (PL-900) certification exam. This certification demonstrates my knowledge and expertise in using the Power Platform to create and manage low-code, no-code solutions for business processes and data analysis.
View badge -
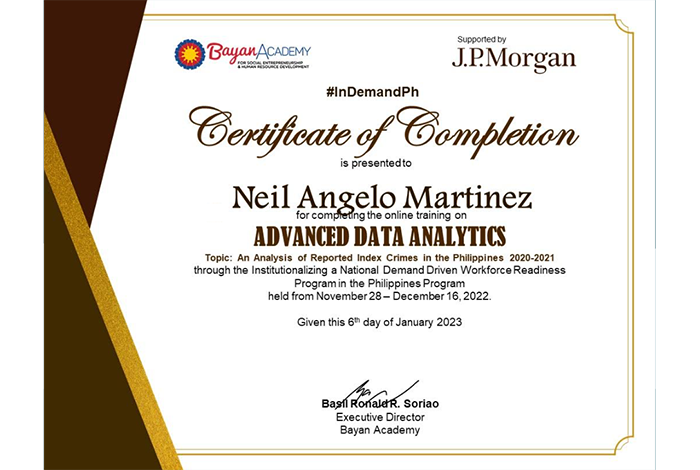
Advanced Data Analytics by Bayan Academy
I've just completed the Advanced Data Analytics program from Bayan Academy supported by J.P. Morgan. This 15-day program covered advanced SQL, Orange Data mining, and writing a research paper. Our research paper focused on "An Analysis of Reported Index Crimes in the Philippines 2020-2021." I'm grateful for the opportunity to deepen my skills in data analytics and gain valuable insights from this program.
Read paper -
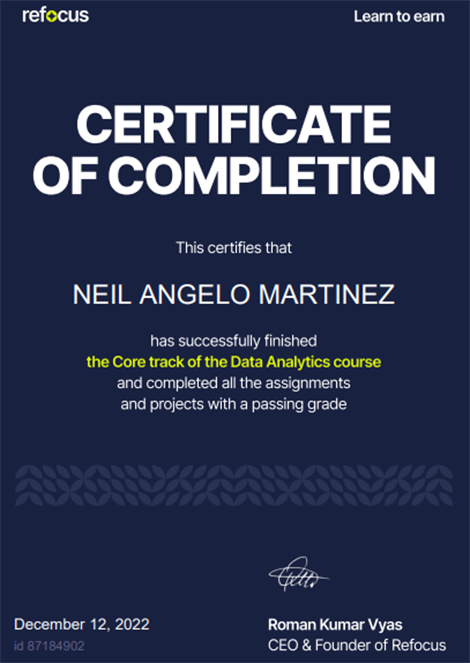
Refocus Data Analytics Core Track Certificate
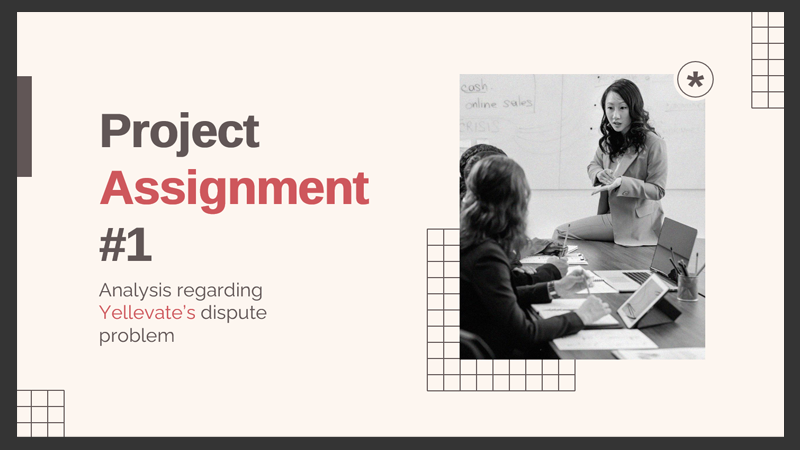
I have completed the core track of the Data Analytics program of Refocus. The core track comprises of Microsoft Excel, PostgreSQL, and Power BI. I have completed 50 hours of video lectures, assessments, and self-study. With 14 assignments passed a lot of skills acquired. During the core track, I have also finished the Group Project: Elevating Yellavate.
View certficate -
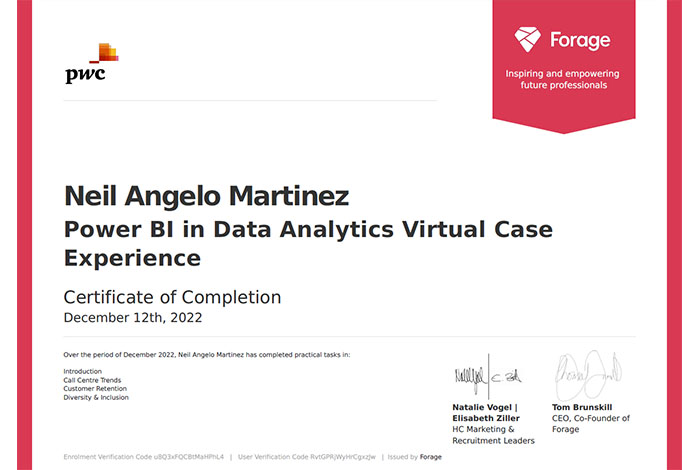
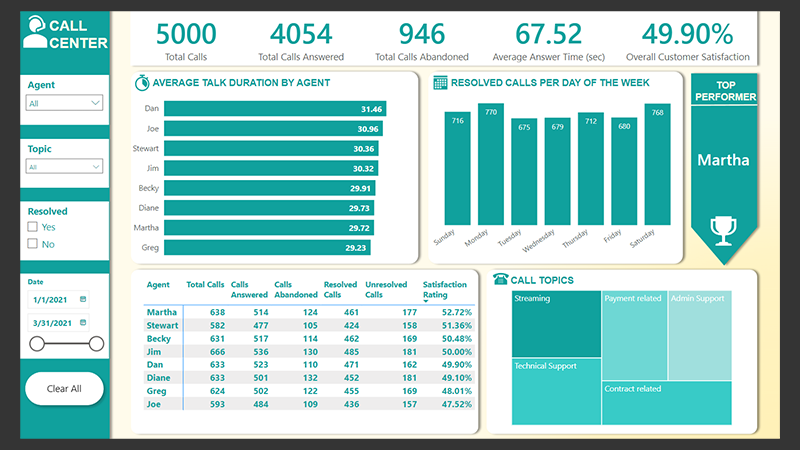
Power BI in Data Analytics Virtual Case Experience by PwC Switzerland
I've completed the PwC Switzerland Power BI in Data Analytics Virtual Case Experience. I have improved better data cleaning and visualization techniques during the course of the program, which has helped me produce more appealing dashboards. Making a dashboard for call center trends, churn analysis, and diversity & inclusion are all tasks.
View certficate -
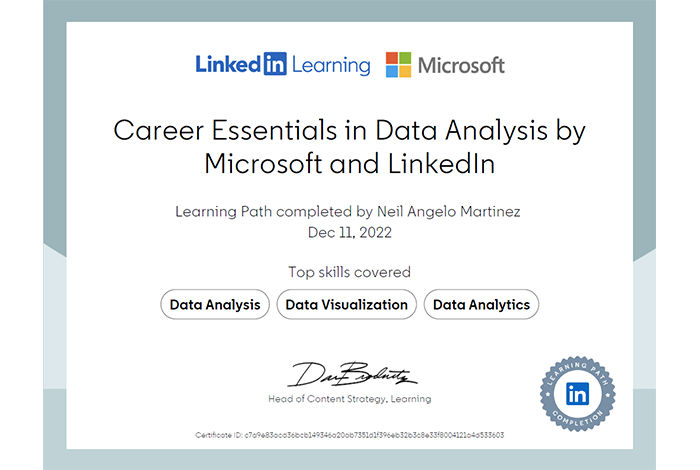
Career Essentials in Data Analysis by Microsoft and LinkedIn
I have completed the Career Essentials in Data Analysis by Microsoft and LinkedIn. It is composed of three courses: Introduction to Career Skills in Data Analytics, Learning Data Analytics: 1 Foundation, and Learning Data Analytics Part 2: Extending and Applying Core Knowledge. After completing the three courses I passed the final exam of the program and got the certificate.
View certficate -
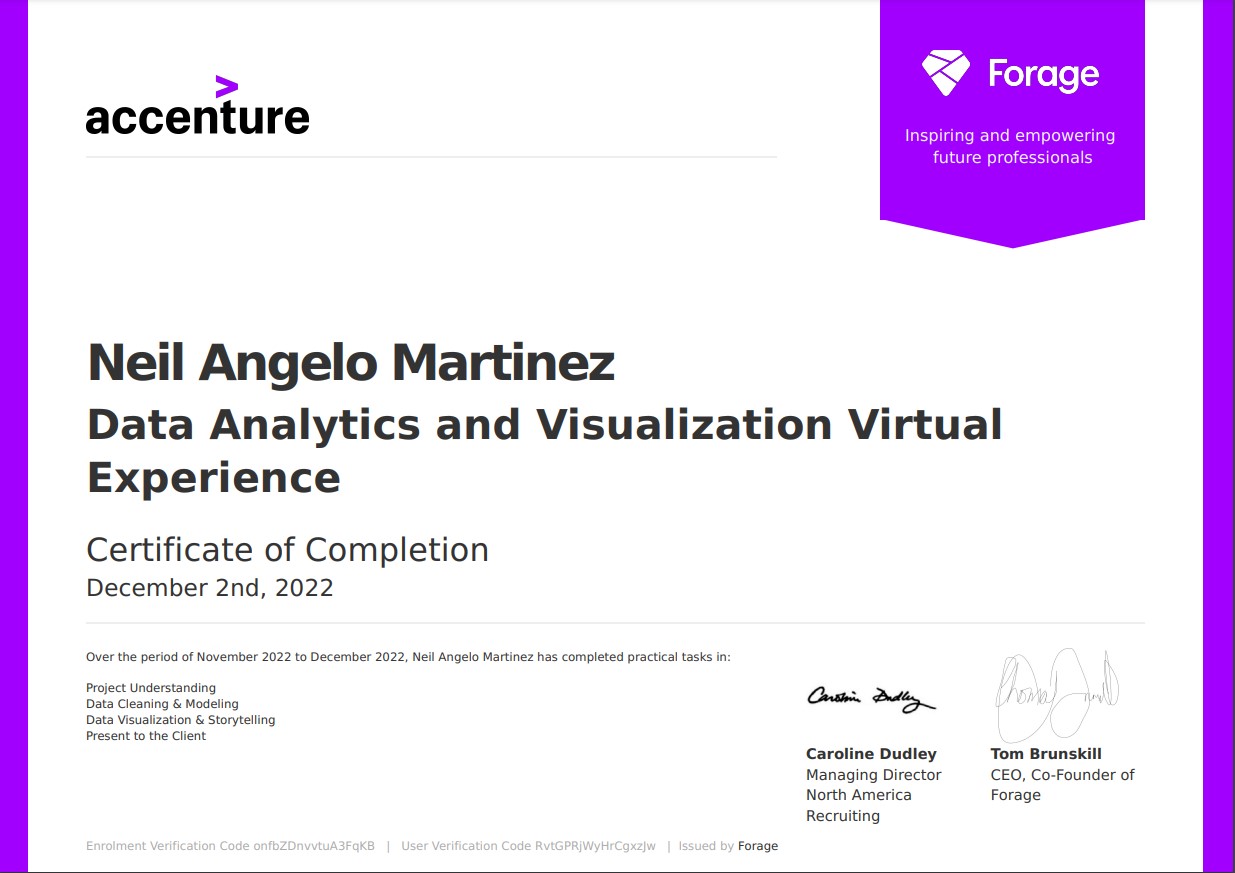
Accenture Data Analytics and Visualization Virtual Experience
I am glad to have finished Accenture's Data Analytics and Visualization Virtual Experience via Forage. This program provided me with an excellent opportunity to learn from industry experts while also gaining hands-on experience with real-world data analytics projects. Through Forage, a portal that offers a variety of virtual experiences in a number of fields, the application program was made available without fee. I was drawn to this program by the chance to learn from Accenture, a leading global professional services company, as well as the ease of completing the program online.
View certficate -
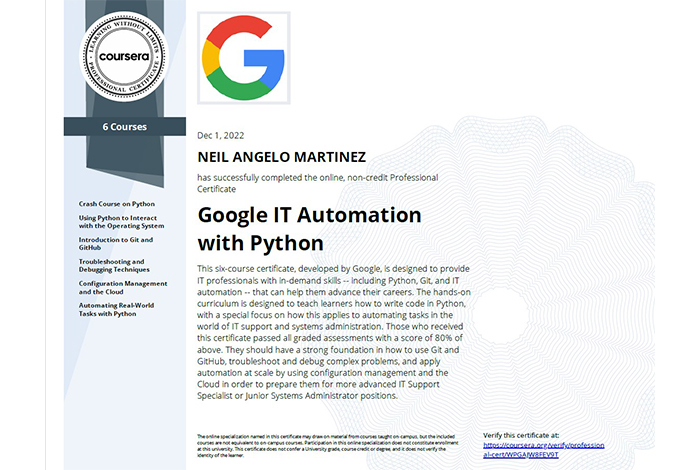
My second Google certification
Since Python is also used in Data Analysis, I enrolled in Google IT Support with Python to further expand my knowledge with Python. I learned a lot of Python commands and in this course where I learned Git, and created my website through Git Pages.
View certficate -
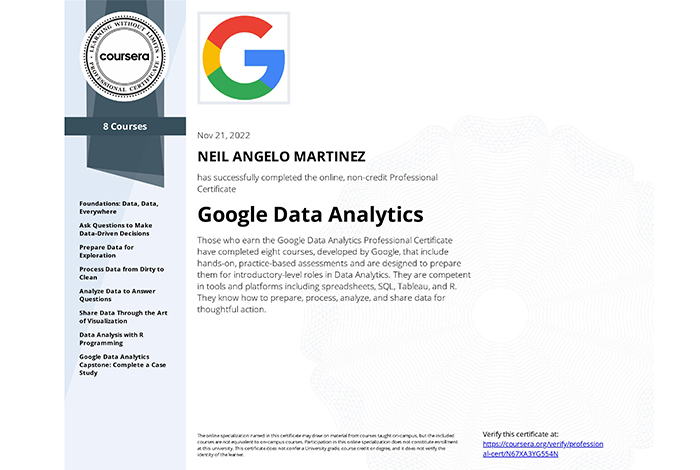
Google Data Analytics Certificate
Completing the Google Data Analytics Certification through Coursera was one of my proudest achievements. This certification program covered a wide range of data analytics topics, such as data visualization and statistical analysis. It took a great deal of focus and hard work, as well as finishing capstone project. This certification has given me the courage to take on new challenges in my profession and has helped me stand out in a competitive job market. I am grateful for the opportunity to have completed this program, and I believe it has given me the skills and knowledge in starting my career as a data analyst.
View certficate -
My journey at Refocus
I received a call from a marketing agent about the opportunity to become a data analyst. Recognizing the potential for a fulfilling and exciting career in this field, I immediately enrolled in Refocus Digital Academy to fast track my education and training in data analytics. I was excited to have this opportunity and was committed to making the most of it. Through my studies at Refocus Digital Academy, I gained a strong foundation in the tools and techniques used in the field, as well as the practical experience needed to succeed as a data analyst. I was confident that this program would provide me with the skills and knowledge I needed to excel in this exciting and rapidly-growing field.
Read more